Tesla Roadster aerodynamics involve several questions that a sleek exterior photograph cannot answer. How much resistance does the vehicle encounter? How is vertical load distributed? What changes when an aerodynamic surface moves or a powered airflow system operates?
The useful starting point is to distinguish drag from downforce. They act in different directions and affect different aspects of performance. A design that produces more vertical load is not automatically the most efficient design for a long highway journey.
Drag: the resistance that grows with speed
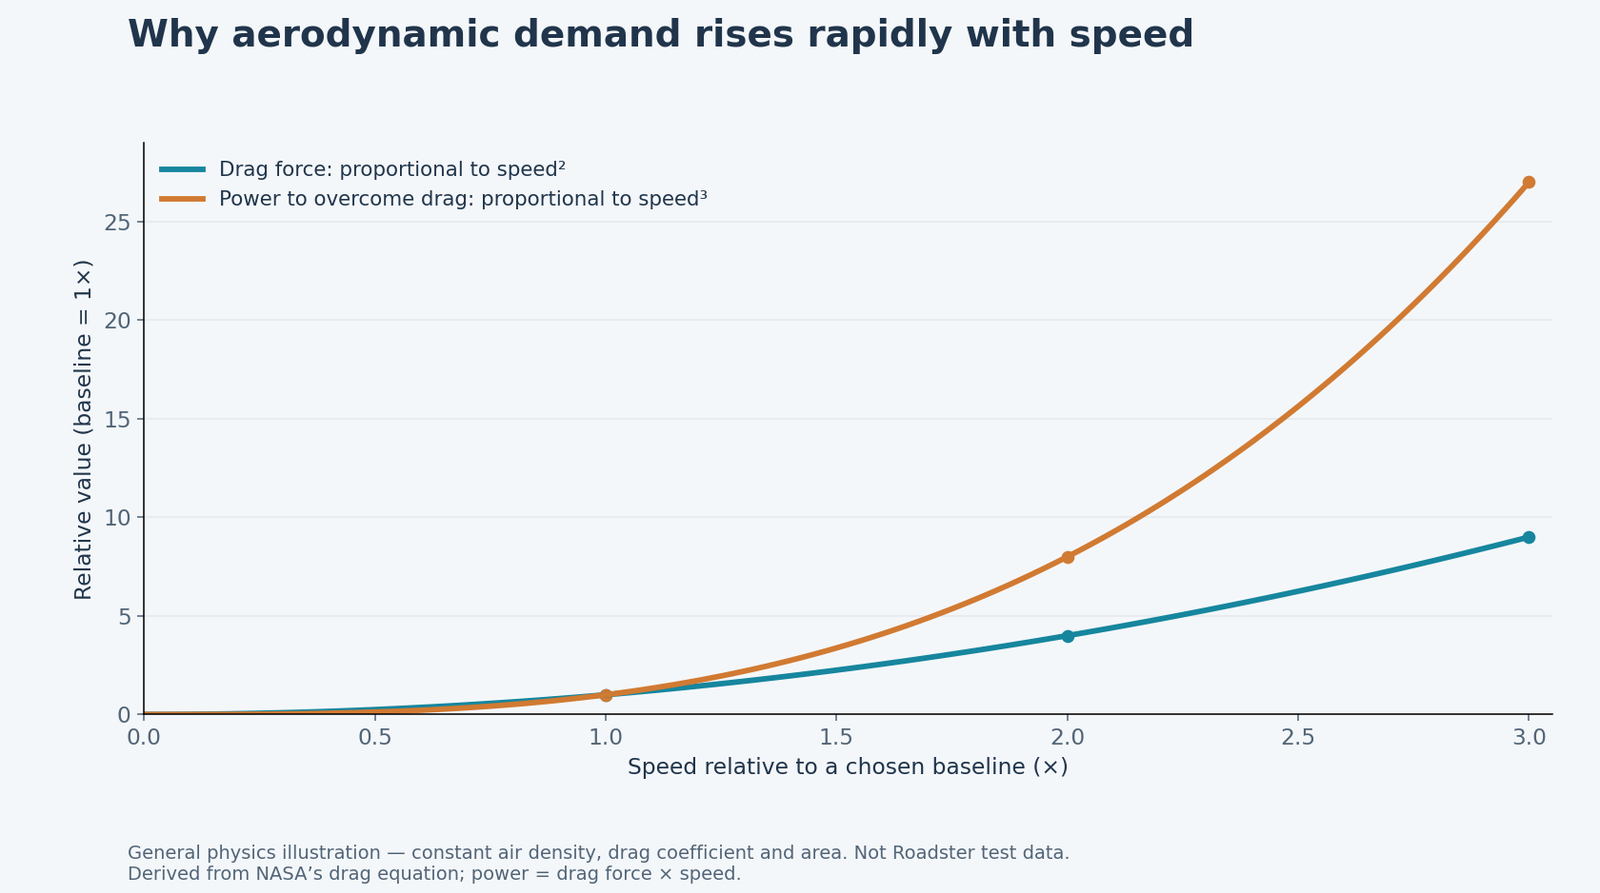
NASA expresses aerodynamic drag using air density, speed squared, a drag coefficient and a reference area. Holding the other factors constant, doubling speed produces four times the drag force. The power needed to overcome that drag rises further because power also depends on speed.
This explains why high-speed travel can be costly in energy. It does not establish the Roadster’s actual drag coefficient. That number requires model-specific data and a clear reference area; a shape cannot be assigned a reliable coefficient simply by looking at it.
Downforce: adding load without adding the same amount of mass
Aerodynamic downforce increases the vertical load carried through the tires. That can influence available grip, but the relationship is more complicated than assuming twice the load means twice the grip. Tire behavior, suspension geometry and the distribution of forces all matter.
Balance matters as well. A change that adds mostly rear load can affect handling differently from one that changes front load. A meaningful assessment should therefore report how the overall vehicle responds, not just a large total-downforce figure.
Why active aerodynamics can change the compromise
A fixed surface has to serve several situations with one shape and position. An active system can alter its setting for different demands, such as reducing resistance on a straight or changing the aerodynamic balance during another maneuver.
That flexibility introduces questions about response time, control logic and behavior during transitions. A system should be evaluated as part of the vehicle rather than as an isolated moving panel. The most useful evidence connects a commanded change with measured forces and predictable handling.
What a powered suction system changes
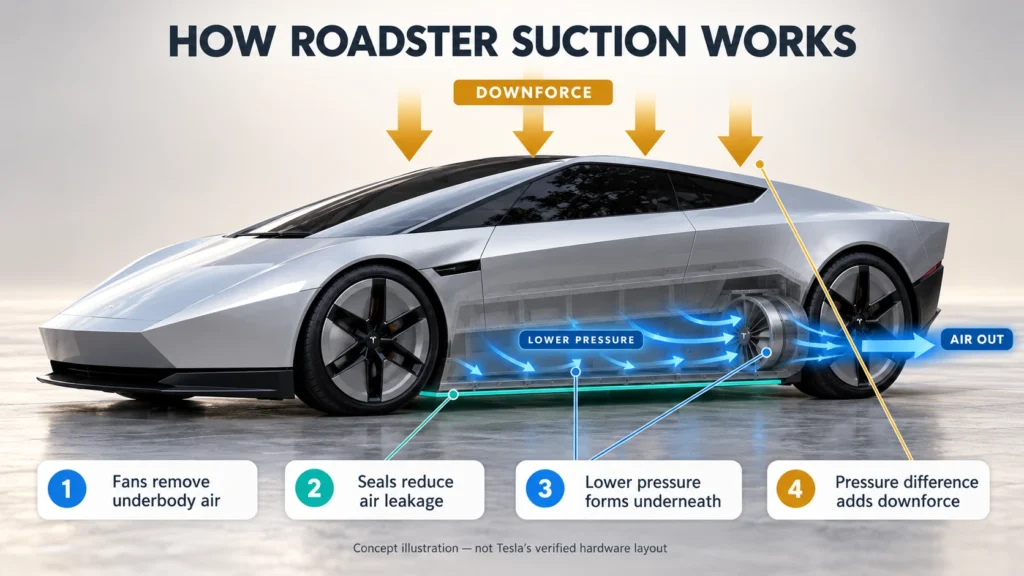
Tesla describes powered airflow and ground sealing in its current presentation. In general engineering terms, lowering pressure beneath a vehicle can create a downward force from the pressure difference across it. A powered system can therefore differ from a conventional surface that relies primarily on forward motion.
The achievable effect depends on the area involved, pressure difference, leakage and energy needed to maintain airflow. Those relationships explain the concept; they do not reveal Tesla’s exact seals, fan output or measured force. The original explanatory graph below shows general aerodynamic scaling, not a Roadster dataset.
For the detailed mechanism, see how the Roadster suction system works, including pressure differences, ground sealing and the evidence still needed.
Energy use, ride height and real surfaces
Powered airflow requires energy, so any handling benefit should be considered alongside its operating demand. Ground clearance and leakage can also influence pressure control. A smooth test surface may not represent every bump, slope or surface transition encountered elsewhere.
This is why a proper evaluation needs operating conditions. Which aerodynamic mode was selected? What was the ride height? How was the road surface characterized? How did the system behave during steering and braking transitions?
What remains unmeasured in this guide
No Roadster drag coefficient, lift coefficient, quantified downforce map or energy penalty is asserted here. Manufacturer descriptions identify the proposed systems, while the physics explains what measurements would make the claims useful.
Read the specifications guide for configuration differences. The thruster article explains why reaction thrust should be assessed separately, and the pillar guide connects the whole series.
Frequently asked questions
Is downforce the same as low drag?
No. One describes vertical aerodynamic force; the other concerns resistance to motion through the air.
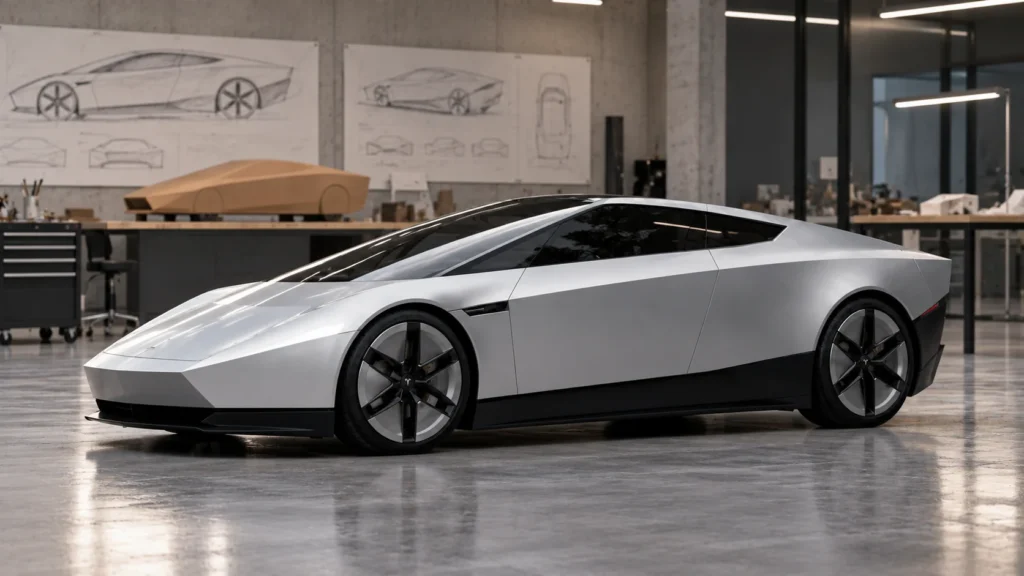
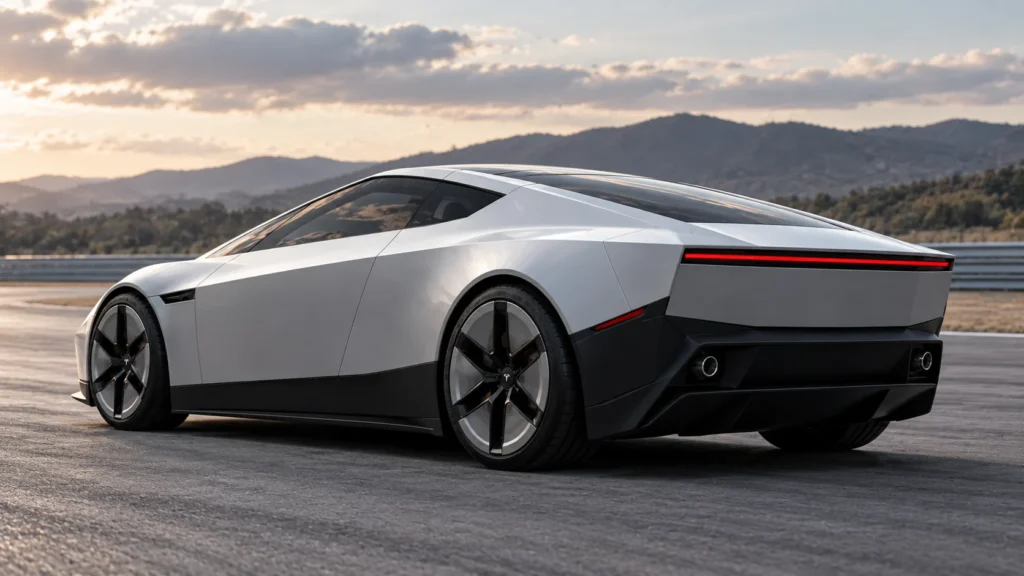
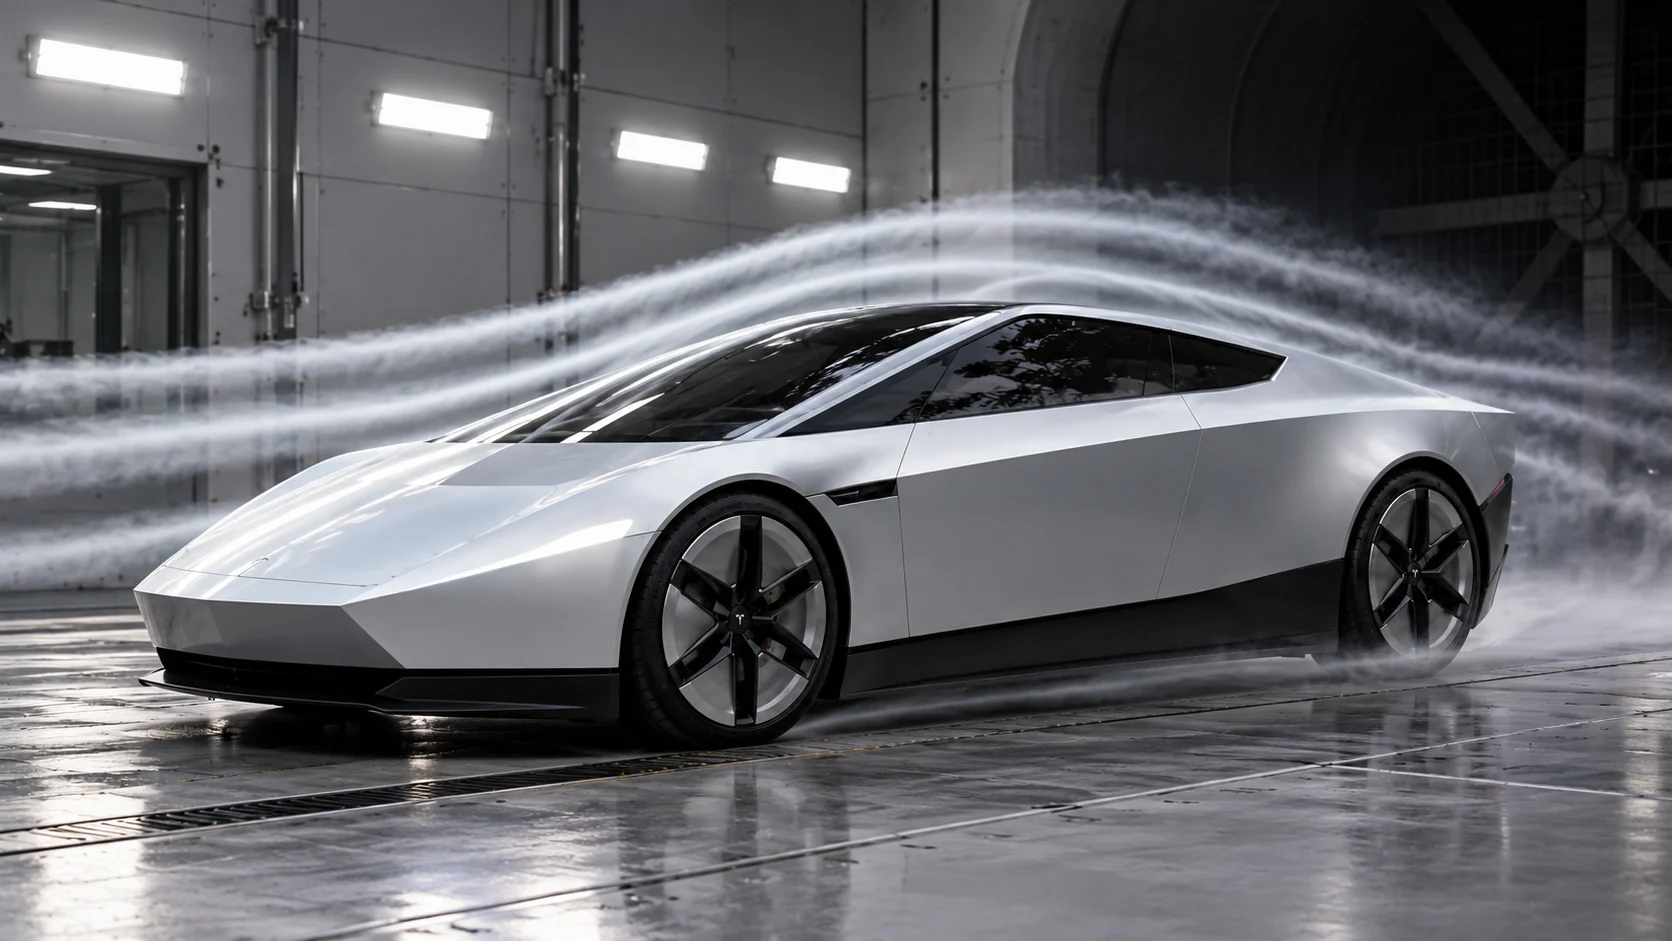
Can a photo establish aerodynamic efficiency?
No. It can show design features, but measurements are needed to quantify their effects.
Does the explanatory chart establish Roadster downforce?
No. It illustrates general drag and power relationships, not Roadster downforce or measured performance.
Sources and research notes
- NASA: drag equation and measurement definitions
- Tesla: active aerodynamic and suction-system presentation
Checked October 16, 2026. General engineering explanations are distinguished from model-specific claims. This article is updated only when new evidence supports a change.